
Bathymetric Survey in Six Fishery Harbours in Oman
Overview
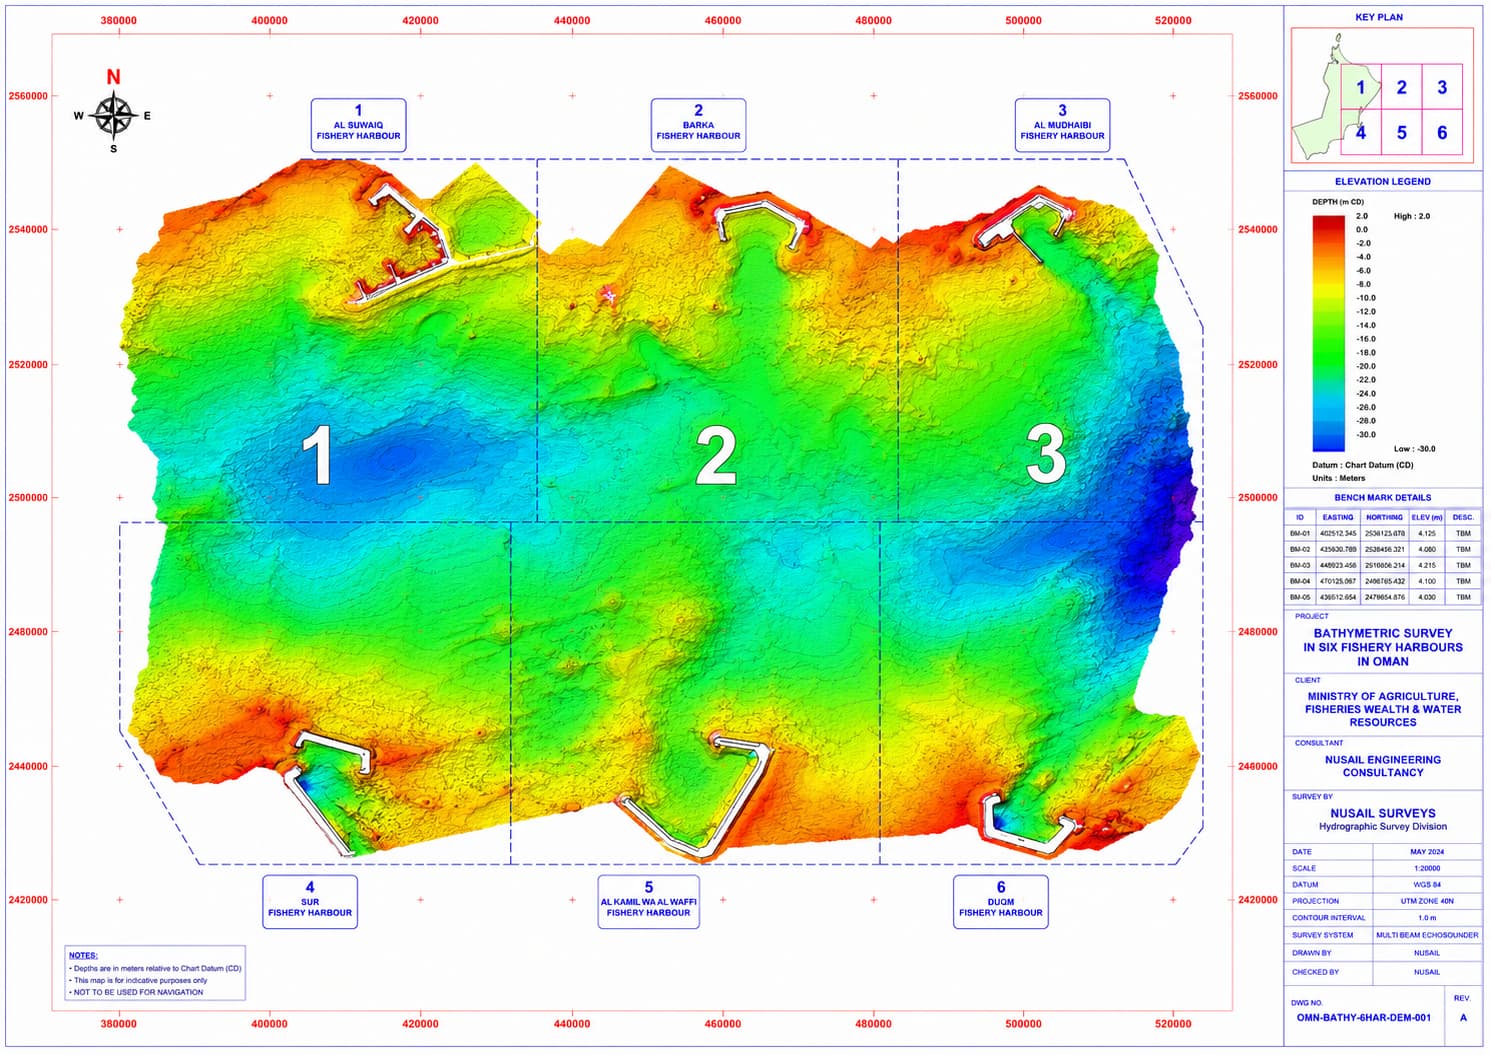
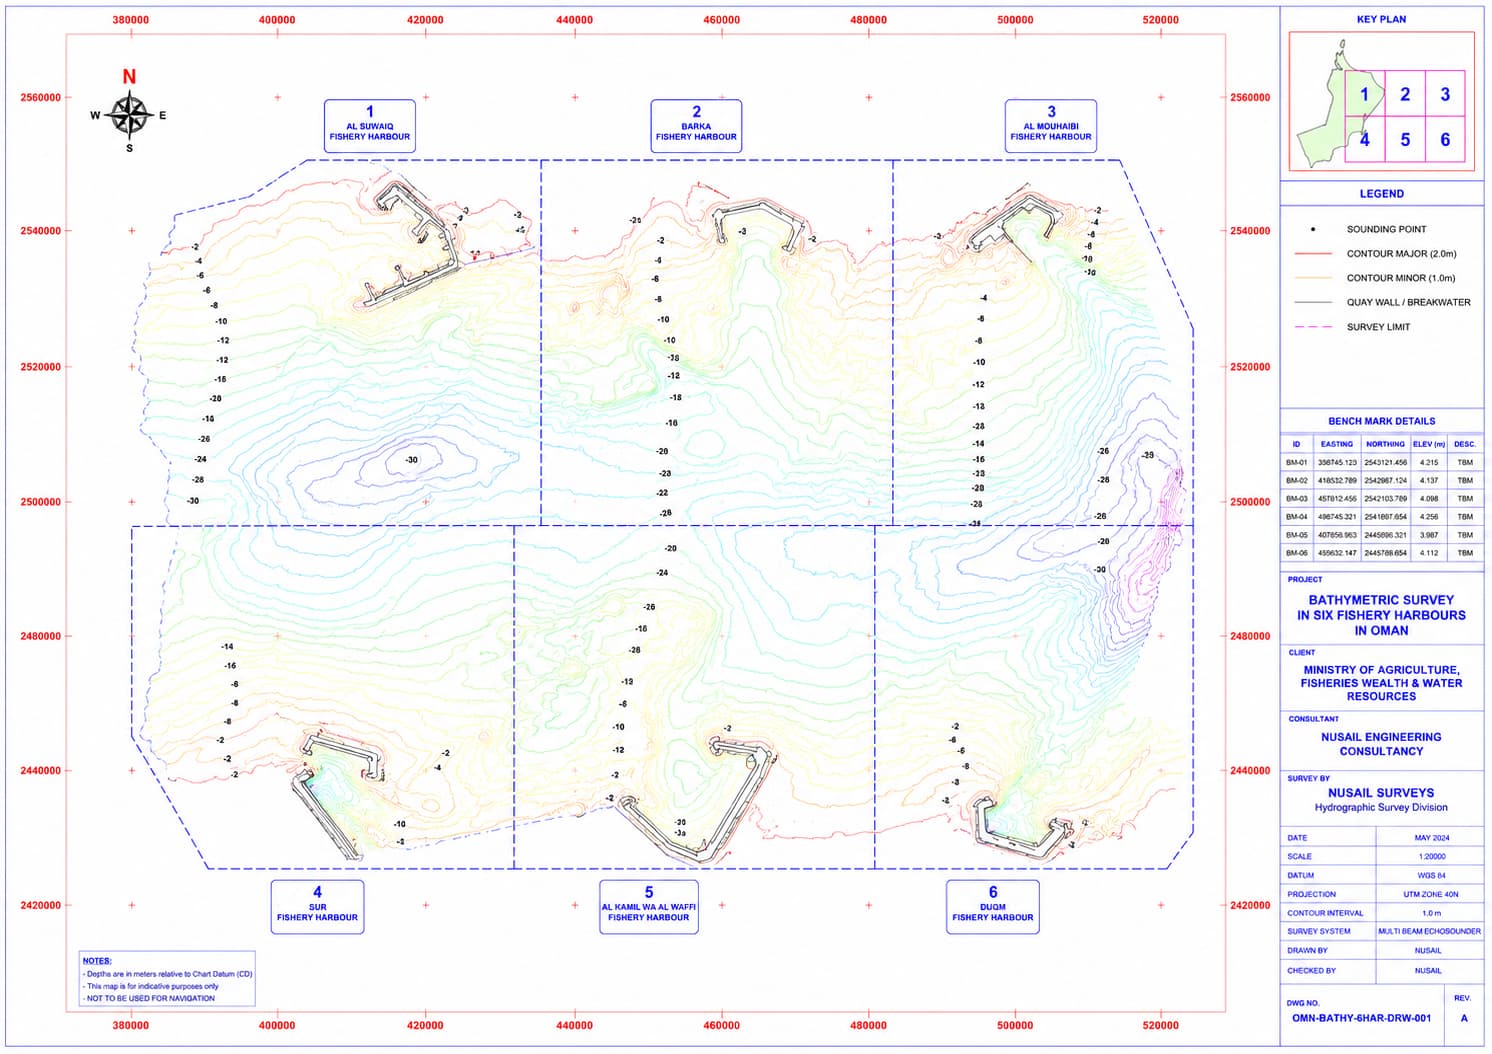
Worley Parsons contracted us to conduct engineering activities for the design of six fishery harbours in Oman. Accurate bathymetric data was required to ensure the harbours were designed correctly, avoiding any under or over-design. We were tasked with performing bathymetric surveys for all six harbours along the Oman coast.
Scope of the Survey
- Conduct bathymetry surveys at the six proposed fishery harbour locations along the Oman coast.
- Establish benchmarks and perform hydrographic surveys at these sites.
Equipment Used
| Equipment | Purpose |
|---|---|
| Odom Hydrotrac Echo Sounder | Depth Measurement |
| Valeport Tide Gauge | Tide Level Recording |
| Sokkia RTK GPS | Positioning |
| Sokkia Total Station | Benchmark Establishment |
| Bar Plate | Calibration |
Proposed Survey Locations
| Site | Latitude (º) | Longitude (º) | Directions |
|---|---|---|---|
| Mahout, Al-Wusta | 20°37'12" | 58°11'37" | 230 km south of Sinaw |
| Al-Shuwaimiya, Dhofar | 17°53'04" | 55°36'33" | 190 km north-east of Salalah |
| Sadah, Dhofar | 17°02'59" | 55°04'20" | 105 km east of Salalah |
| Rakhyute, Dhofar | 16°44'43" | 53°25'19" | 76 km south-west of Salalah |
| Dibba, Musandam | 25°38'59" | 56°16'10" | 61 km south of Khasab |
| Kumzar, Musandam | 26°20'29" | 56°25'07" | 22 km north-west of Khasab |
Bathymetry Survey Procedure
During the bathymetric survey of each fishery harbour, Nusail installed an automatic water level recorder to describe sea conditions. An Odom HT100 Echo Sounder was used, with 200 kHz digital output logged by the navigation computer. CTDS dips and bar checks were performed daily before starting the survey. Draft and mean sound speed values were entered into the echo sounder processor at the start of each day. The phase and speed settings were adjusted to ensure the best possible record, clearly identifying annotation fix numbers and line start and end information.
The Sokkia navigation system, equipped with HydroPro software, converted GPS-derived latitude and longitude into local UTM projection coordinates. Positions were entered into the navigation system and displayed on the helmsman's display. Fixes were taken at 20 m intervals along each line, and all data from peripherals was logged into the software.
